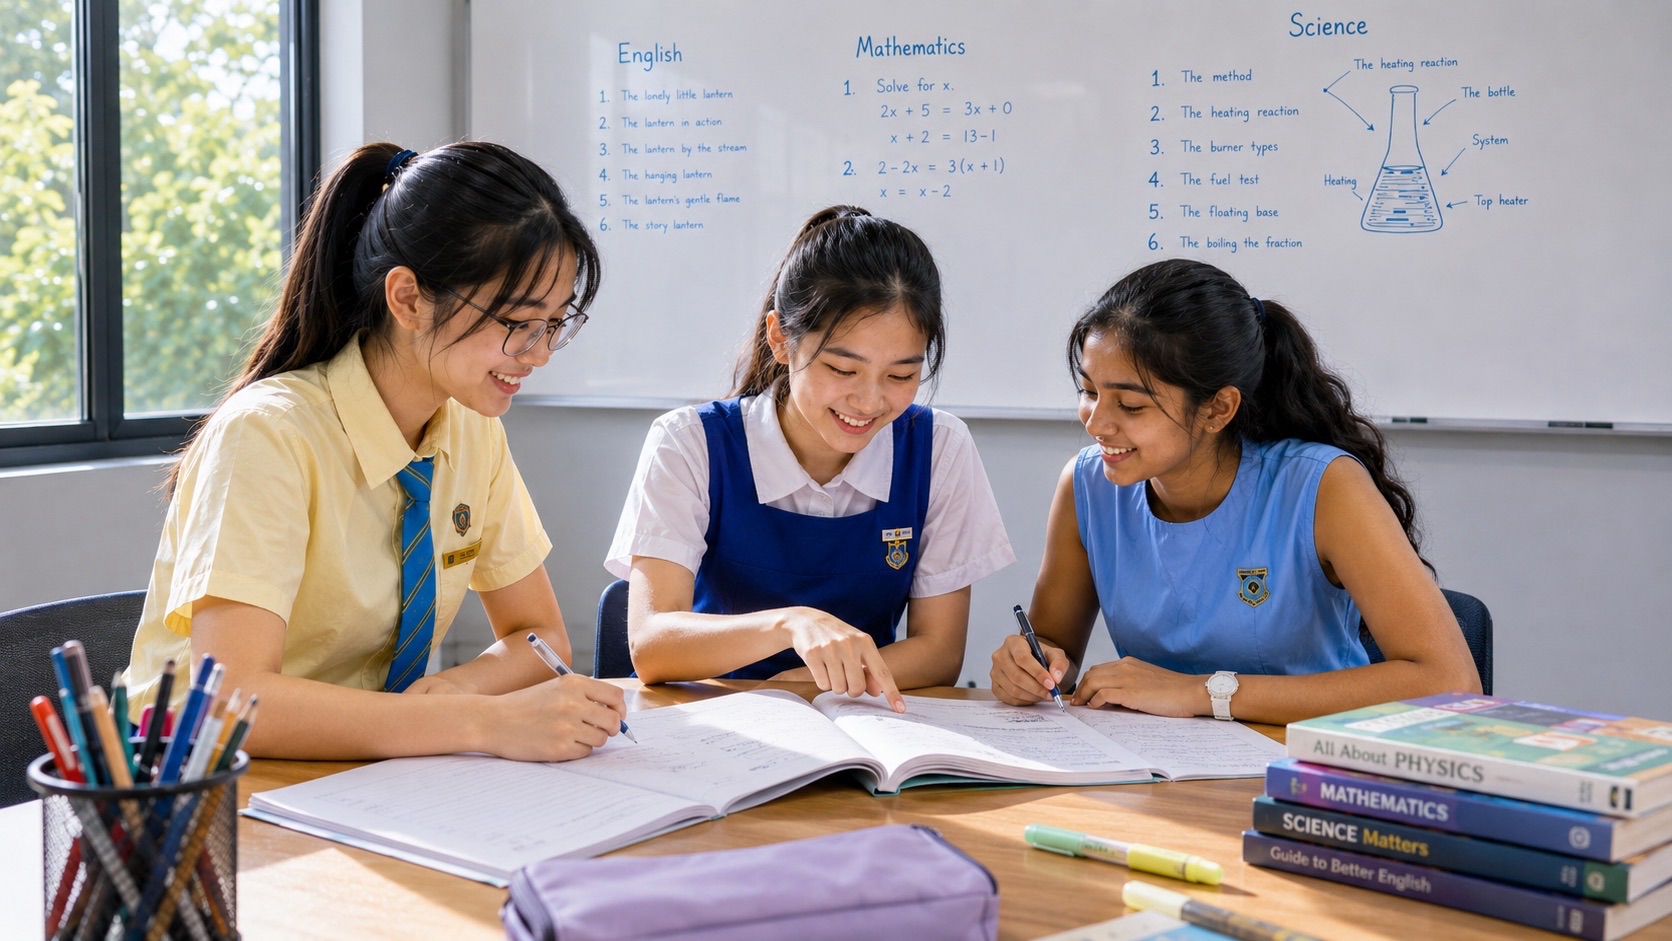
Secondary 1 G1 Mathematics small groups tuition for Ang Mo Kio students can help when your child can calculate an answer but hesitates over a table, chooses the wrong scale on a graph or struggles to explain what a figure means. In a three-student eduKate group, a tutor can see each learner’s reading and working, ask them to explain one decision aloud and give them a fresh question to try independently. Bring a recent school worksheet or exercise if you want to find out where the difficulty starts.
Secondary 1 G1 Mathematics builds on Primary 6 number skills while asking students to organise data, interpret graphs and explain comparisons in context. Start with the current school topic and repair the specific habit that is getting in the way, whether that means reading the axis label, converting a pictogram symbol into a count or choosing the correct total for a pie chart. These habits also support applied Mathematics questions later in secondary school, including preparation for the Singapore-Cambridge Secondary Education Certificate, or SEC.
- Ask your child to point to the two values they used and say what each value counts or measures.
- Match the graph to the question. Use bars to compare categories and a line graph to show how a measurement changes over time.
- Give every answer its unit and make every comparison specific. An increase of 4 people and an increase of 4 percentage points tell different stories.
- Judge a small group by how much independent work your child does after receiving feedback. Ask to see a corrected example and a different example completed alone.
- Use the school’s current topic list and assessment instructions for Secondary 1. Keep the national examination reference for the cohort that will actually take it.
Contents
Start with what your child does on the page to Read a table before making a comparison
Draw a bar graph from the table to Understand the whole behind a pie chart
Choose the display a reader can use to Decide what help fits your family
A four-week plan with room for school priorities to Keep Secondary 1 assessment and the SEC in view
Start with what your child does on the page
Imagine opening a school worksheet with your child on a Tuesday evening. A graph shows how many workbook pages a learner completed on four days. Your child says the greatest increase was on Thursday because the Thursday mark is highest. You can see that the question is about the difference from one day to the next. Your child, meanwhile, has answered a perfectly sensible question of their own. The tutor’s work begins when somebody finds out which question the child is answering and shows how to find the one on the page.
Ask them to mark the word that describes the job. The largest number calls for an individual value. The largest increase calls for pairs of consecutive values and a subtraction for each pair that rises. When the student can identify the job and present the right evidence, they can use the same skill on a graph about something else. This makes a small, focused correction more valuable than completing a page of questions whose wording and layout are identical.
There are several ways a tutor might find the source of an error. They can ask the student to read the graph aloud, to point to the labels and scale, to copy the two relevant values or to state how they would know the answer was reasonable. A child who copies 16 correctly but subtracts in the wrong order needs a different next exercise from a child who thinks the next gridline after 10 is 11 when each interval is worth 2.
For a parent, the simplest first step is to see a short attempt before offering help. You might say, “Show me what you would check first,” or “Can you tell me what that 12 is counting?” Keep the question open long enough for them to choose. If you routinely supply the scale or the starting value, the exercise records what the two of you can do together. It gives you less information about what your child will do in class on their own.
How data fits into Secondary 1 G1 Mathematics
At Secondary 1, the G1 curriculum includes basic data collection, classification and tabulation. Students interpret information in tables, bar graphs, pictograms, line graphs and pie charts. They consider what different representations do well and where each gives the reader less information. The year also develops number work, ratio and percentage, algebraic notation and substitution, angles, symmetry and measurement. Those strands meet on an ordinary data question. A student may need a fraction to turn a pictogram’s half-symbol into a count or a percentage to make a pie chart sector. The level-by-level content appears in the Secondary G1 Mathematics syllabus.
Some ideas that children hear about in general discussion of statistics sit later in the G1 syllabus. Histograms, calculating mean, median and mode for ungrouped data, and simple probability belong to the Secondary 2 content in the published level breakdown. If a Secondary 1 child is working to master a bar graph and a pie chart, future topics can wait while the current skills settle. Ask your school which sections it has taught and which types of question the upcoming assessment will cover. The syllabus indicates scope across the years and the school provides the instructions for its assessment.
A Primary 6 student may already be comfortable reading the tallest bar or using a pie chart to answer a familiar fraction question. Secondary 1 adds value when your child learns to say exactly what a representation includes, choose a useful representation, and justify a comparison with numbers. A worksheet can put two related tasks side by side. The first asks how many children selected a category. The second asks whether that category was chosen by more than half the respondents. The first needs a lookup. The second also needs a total and a comparison with half.
To see the difference, try this oral question. A group counted 12 books borrowed on Monday, 16 on Tuesday and 14 on Wednesday. Tuesday had the most borrowings. Did Tuesday account for at least half of those borrowings? The total was 42, so half was 21. A student can read “most” in everyday speech as “the biggest of the choices” and still give a correct first answer. Encourage them to use phrases such as “the largest single count” and “more than half” carefully. That precision pays off across Mathematics word problems.
Contents · Previous section · Next section
Collect a small set of data that can be checked
A manageable activity begins with one question and one clear definition. For instance, “Which route did you use for the final part of your trip to the library today?” is more precise than “How do you travel?” Ask each participant to choose one of four categories, walking, bus, train or another way. Use a practice list your family invents or collect answers from people who agree to help. A small sample can teach the method without supporting a claim about everyone in Ang Mo Kio.
Suppose we create 15 practice responses. Six use walking, four use a bus, three use a train and two choose another way. First, create one row for each possible response. Next, mark a tally when each response is read and record the totals. Check that 6 + 4 + 3 + 2 equals 15. The result gives you an audit trail. If the source list has 15 entries and the count adds to 16, you can revisit the marks and see which answer might have been counted twice.
There is a teaching opportunity in how the options are worded. “Bus” and “bus or train” are awkward categories for a single-choice question because they overlap. A student may also ask whether a walk from the bus stop should count as walking. If you mean the main mode used on the way there, say so before collecting the answers. Revising the question in advance lets your child understand why a neat graph can be based on a poor count.
Another topic is leaving room for the unexpected. If a participant chooses a mode outside the listed options, record it as “another way” under the rules you have set. If a response is missing, record that separately from an “another way” choice. The first means you did not get an answer. The second is an answer. In school questions, students should use the categories and definitions provided. In practice data they collect, they can make these choices visible.
Finish by asking the child to write one bounded statement. “Among these 15 practice responses, walking had the highest count at 6” is supported. They can also say that walking was chosen by 6 out of 15 respondents, or 40%. Either answer connects a mathematically correct value to the people represented. This is an early form of a habit that matters later. The child learns to check what a sentence claims against what is actually available in the table or chart.
Contents · Previous section · Next section
Read a table before making a comparison
A table can tell a longer story than it seems to at first. Suppose an after-school activity collected food tins on three days. On Monday, Group A brought 8 and Group B brought 11. On Tuesday, Group A brought 15 and Group B brought 12. On Wednesday, Group A brought 10 and Group B brought 14. If we put days down the side and groups across the top, every space has a row and a column label. Read both before choosing a number.
Ask, “On which day did the two groups together bring the most?” Start with Monday, 8 + 11 = 19. Tuesday gives 15 + 12 = 27. Wednesday gives 10 + 14 = 24. The answer is Tuesday, with 27 tins. The largest single count was 15, also on Tuesday, so a child could pick Tuesday for the wrong reason. Ask them to show the three day totals. A useful follow-up is to change Monday’s Group B count to 21. The Monday total becomes 29 and the new answer is Monday.
A different question is “Which group brought more over the three days, and by how many?” Now sum along the group columns. Group A brought 8 + 15 + 10 = 33 tins and Group B brought 11 + 12 + 14 = 37 tins, a difference of 4 tins. The same data supported both calculations. Reading the row and column labels tells the student how to rearrange their thinking. A confident answer includes the name of the group and the size and unit of the difference.
A learner can practise by writing a short note beside the table, such as “day totals” or “group totals.” They can circle the first pair of values before doing arithmetic. When they finish, have them check the overall total along both routes. Here the day totals sum to 19 + 27 + 24 = 70. The group totals also sum to 33 + 37 = 70. This is useful when a table has many cells and a single copied number can disturb more than one answer.
At home, print or draw a small table and ask who or what every number describes. If the child correctly reads one cell, move to a deliberately different request that uses two cells from different rows. Adults can add difficulty through the question while keeping the arithmetic accessible. That helps separate quality of reading from speed of calculation and gives a tutor specific evidence to examine.
Contents · Previous section · Next section
Draw a bar graph from the table
Imagine a display of four practice counts for the number of students who borrowed books in four categories. Adventure has 18, science has 10, mystery has 14 and biography has 6. A bar graph allows an immediate visual comparison. Put the four category labels along the horizontal axis and label the vertical axis “Number of students.” For these values, a vertical scale from 0 to 20 in steps of 2 is sensible. Equal steps make the height of each bar match its value.
Start with a zero baseline for an ordinary count comparison. The bars should have equal widths and visible gaps, because each represents a separate category. Draw the adventure bar up to 18, science up to 10, mystery up to 14 and biography up to 6. Give the graph a clear title such as “Books borrowed by category.” If the counts refer to students and each chose one category, that wording can be made more precise in the axis or title. The aim is for the reader to know what the heights count without asking the person who made the graph.
When choosing a scale, prepare the labels before drawing the first bar. A student who sees 18 and labels the first gridline 10 and the next 20 may be able to plot the height but needs a way to estimate between the marks. A smaller step can make this dataset easier to read. A scale that marks every number from 0 to 18 can also work if there is space. Ask your child to show where the value 14 would go and why. They should be able to say how many intervals above zero it sits on their chosen scale.
A bar graph lets the child see the difference between adventure and science quickly. That difference is 18 − 10 = 8 students. It also supports a comparison between two pairs. Adventure and biography together represent 18 + 6 = 24 students. Science and mystery also represent 10 + 14 = 24 students. A tall bar and a short bar can add to the same total as two middle bars. That is a good example of why the eye and the arithmetic should confirm each other.
One useful check is to give the graph to another person who has never seen the table. Ask them to read off all four values. If they can recover each value and say what it measures, the graph has done its job. If they can only rank the categories, look at whether the scale, units or category labels are missing. A teacher can see quite quickly which part of the graph caused the trouble when the student also retains the source table.
Read scales that begin and end in different places
A printed school question may show numbered marks at 0, 10, 20 and 30 with smaller intervals in between. Four equal spaces between 10 and 20 mean each space is worth 2.5. Five equal spaces between those same labels mean each is worth 2. A common first attempt is to count the visible lines and miss the number of intervals. Ask the child to put a pencil point at 10 and move it step by step to 20. Count the moves. The difference between the printed labels divided by the number of spaces gives the value of one move.
You can practise this on an ordinary number line. Mark positions evenly spaced between 20 and 40 in four intervals. Your child should write 25, 30 and 35 in the three inner positions. Then place a marker halfway between 30 and 35 and ask for its value, 32.5. Use a measurement context such as litres or minutes for non-whole numbers. A graph showing a number of students should reflect whole people, even when its scale includes fractional subdivisions.
Two separate graphs may have different scales while looking alike on a page. Suppose one vertical axis uses steps of 5 and the other steps of 10. Matching bar heights on paper can represent different values. Read each axis before comparing the underlying counts. A student who always checks what one interval means will be able to handle changes in layout with less uncertainty.
Contents · Previous section · Next section
Decode a pictogram before totalling the symbols
A pictogram uses a key to tell the reader the value of a whole symbol. Imagine a practice chart showing fruit portions prepared for a family activity. One whole image represents 8 portions. Mango has two whole symbols and one half-symbol. Pineapple has one whole symbol and one half-symbol. Watermelon has three whole symbols. Calculate the half first. It stands for 8 ÷ 2 = 4 portions. The respective values are 20, 12 and 24 portions.
Ask first which fruit had 12 portions and how the student can tell. They should identify pineapple and show 8 + 4. Ask next how many more watermelon portions were prepared than pineapple portions. The counts are 24 and 12, so the difference is 12 portions. A child who says “one and a half symbols” has spotted the visual gap. Invite them to use the key and translate that visual difference into portions. Both routes can lead to 12.
A single row can teach proportional reasoning. With a key of 8, let your child draw 28 portions. Three whole symbols stand for 24 and a half-symbol adds 4. Then change the key to 4 and ask what drawing is required for the same 28 portions. Seven whole symbols are needed. The data stays fixed while the representation changes. Choosing a key balances simplicity, space and which parts of a symbol learners can draw and read clearly.
If your child draws their own pictogram, agree on suitable data before drawing. Under a key of 6 items per symbol, 3 items can be shown with half a symbol. If the data includes 5 items, displaying exactly five sixths of a symbol may make the graph difficult to interpret. You could choose another key or a different display such as a bar graph. When asked whether a pictogram is useful, the student should connect their answer to the values and the amount of detail the audience needs.
Contents · Previous section · Next section
Use a line graph to compare changes over time
The line graph earns its place when order matters. For practice, imagine that a timer recorded the number of pages a student had read in total at the end of each of four days. At the end of Monday the total was 6, at the end of Tuesday it was 11, at the end of Wednesday it was 13, and at the end of Thursday it was 22. Put the days in order on the horizontal axis. Put total pages on the vertical axis. Place one point for each reading and join successive points if the question asks for a line graph.
The value from Wednesday is 13 pages read in total by then. The increase from Tuesday to Wednesday is 13 − 11 = 2 pages. The increase from Wednesday to Thursday is 22 − 13 = 9. The increase from Monday to Tuesday is 11 − 6 = 5. If the question asks which recorded interval had the biggest increase, the answer is Wednesday to Thursday, when the cumulative total rose by 9 pages. Wording matters. The 22 pages are the cumulative total through Thursday, while 9 pages is the change since Wednesday’s reading.
A plain line graph also works for measurements that rise and fall. Consider a thermometer read at 8 am, noon, 4 pm and 8 pm. The values are 26 °C, 31 °C, 29 °C and 27 °C. The highest recorded temperature is 31 °C at noon. The temperature dropped by 2 °C from noon to 4 pm, and it also dropped by 2 °C from 4 pm to 8 pm. Across the entire twelve hours, the final recorded temperature is 1 °C higher than the initial reading. Each of those answers uses a different pair of points or a single reading, according to the question.
A learner who sees a continuous line may feel able to identify the precise value at an unmeasured time. Say the noon and 4 pm readings are joined by a straight line. Reading 30 °C at 2 pm can be an estimate from the graph. The only actual figures supplied were the readings at the labelled measurement times. Unless the question states that a rate was constant or that a value is to be estimated from the line, use wording that respects the difference. Writing “the graph estimates 30 °C at 2 pm” is more careful than claiming a thermometer showed it.
Horizontal spacing matters when a time axis is scaled numerically. A time axis marked from 8 am to noon to 4 pm to 8 pm can use equal spaces because the intervals are all four hours. If readings are at 8 am, 9 am and 1 pm on a scaled time axis, one hour and four hours take different amounts of space. For a graph with named days shown as separate observation points, follow the school question’s axes. Have students label points before drawing lines. The movement of the pencil should be the final step after the maths is clear.
Contents · Previous section · Next section
Understand the whole behind a pie chart
A pie chart shows how a whole is divided. Imagine 40 students each choose one activity for a fictional class event. There are 16 votes for drawing, 12 for puzzles, 8 for sport and 4 for reading. Check the counts first. The total is 16 + 12 + 8 + 4 = 40. Drawing takes 16/40 or 40% of the whole. In the pie chart, its angle is 16/40 × 360° = 144°. Puzzles account for 108°, sport for 72° and reading for 36°. Add those angles and the result is 360°, one full turn.
A ratio helps students check whether their sectors make sense. Four votes correspond to 36°. Eight votes are twice as many, so the corresponding sector should be twice as large at 72°. Drawing received 16 votes, fewer than the 20 needed for half the circle. Its angle should therefore be below 180°. These short checks help a child discover a wrong entry before they draw the sectors.
Reverse the question next. A school display shows a sector of 90° for a reading group. The full chart represents 48 students. The sector is 90/360, or one quarter of the whole, so the number of students is 48 ÷ 4 = 12. A student who can explain “90 degrees is one quarter of a circle” has understood the structure. They may also calculate 90 ÷ 360 × 48. The working should state what the fractions and counts represent.
Some school questions compare two pie charts. Imagine a club with 20 participants and another club with 40. Half of each club chose the same option. The angles are equal at 180°, while the counts are 10 and 20. A comparison of proportions needs just the fractions or angles. A comparison of actual counts also needs the total for each group. If the totals are absent, explain which comparison the information does support.
Children can practise drawing with a pencil, ruler and protractor. Start with a point for the centre and a straight radius. Line up a protractor accurately, then mark off the first angle from that radius. Draw the next radius through the mark. Continue from the newest radius, and label each sector. When the data produces angles with long decimals, follow the school’s rounding instructions. The example above uses whole-degree angles, so it is a good first drawing exercise for checking alignment and reading the correct scale on the protractor.
A pie chart makes sense when the categories form a defined whole. A survey that allows each participant to choose several activities can produce more votes than participants. In that case, a pie chart of votes could show the share of votes for each option if clearly labelled. To report the share of students who chose each option, bars with percentages may be clearer because those percentages can sum to more than 100%. State what was counted and what the denominator means every time.
Contents · Previous section · Next section
Choose the display a reader can use
A student helping with a school project may see the choice of graph as a presentation detail. In practice, the choice determines what a reader notices and how accurately they can extract an answer. Use a table when the reader needs several exact values. Use a bar graph for a fast comparison between distinct categories. A pictogram can introduce a simple comparison when a repeated symbol represents a stable quantity. A line graph can show a change across ordered readings. A pie chart shows parts of a defined whole in one view.
Use the same question to bring out the trade-offs. Take four weekly counts of the number of people who returned borrowed books at a school activity. The values are 14, 18, 15 and 23. A table makes it easy to read that the second week had 18 returns and the fourth had 23. A line graph emphasises that the count rose, fell and then rose again. A pie chart could show what share of all returns fell in each week, though it makes the rising and falling pattern harder to scan. Ask your child which method they would choose if the activity organiser wanted to decide when to assign an extra helper.
Ask them to finish a sentence of the form “I would choose a line graph because it shows how the number of returns changed from one week to the next.” If they choose a table for the same task, they could justify that choice by saying the organiser needs exact weekly counts for planning. In school, read the wording closely. Some questions request a specific type of graph, while others invite an explanation of suitability. A good explanation refers to the data and the reader’s purpose.
Two displays can also work together. A page may show a small table with weekly counts and a simple graph of the same data. The student can use the graph to spot the biggest change and refer to the table for exact numbers. At tuition, try letting the three learners choose different displays for one dataset and explain the differences. After the discussion, give each student a short fresh dataset and ask them to pick a display on their own.
Contents · Previous section · Next section
Explain a data answer in a complete sentence
A student might correctly write 18 − 12 = 6 and still leave a reader wondering what 6 measures. A complete comparison identifies the categories or times, the direction of the difference and the unit. “On Tuesday, Group A packed 6 more bags than Group B” does the job if Group A packed 18 and Group B packed 12. When wording allows it, students can reduce risk by recording three lines. Write both values with their labels, show the calculation and answer the question in words.
Develop the same care with percentage. Suppose the share of participants who walked to a fictional event was 25% in Week 1 and 30% in Week 2. The difference is 5 percentage points. A question about percentage change relative to Week 1 instead calls for (30 − 25) ÷ 25 × 100% = 20%. The first answer measures the gap between the stated percentages. The second states the increase as a proportion of the starting percentage. If the two weeks had different total attendance, the direction of change in the underlying counts may need separate checking.
Try a count example with an easy starting point. In Week 1, 25 out of 100 attendees walked. In Week 2, 15 out of 50 walked. The walking share rose from 25% to 30%, while 10 fewer people walked in Week 2. Both sentences can be true because the groups changed in size. This is a helpful challenge once a child can calculate basic percentages. It also teaches them to pause when a question says “more” and identify exactly which quantity is being compared.
Another sentence to practise is “From the information given, we can say…” Finish it only as far as the evidence allows. A table showing that 14 students took a bus and 10 used a train can support a comparison of those counts. It may say little about which route was quicker since travel time is absent. Invite your child to name one additional piece of information needed to answer the new question. For speed of travel choices, comparable starting points and door-to-door times would matter.
Contents · Previous section · Next section
What a productive three-student session looks like
In a small-group lesson, a tutor can begin by giving the same short prompt to all three learners. For example, the task asks them to locate the largest change in a line graph. All three write privately for a few minutes, and the tutor checks how they chose the points. One student may have read the highest point, another may have calculated the correct difference without units, and a third may have copied an axis value incorrectly. Each learner has revealed a different step to work on.
During the discussion, ask each student to explain one decision that can be verified. The first might name the two dates whose values they used. The next might point to the grid interval. The third may state the difference and its unit. The group can hear a few clear ways to describe the same process. The tutor can then assign each child one nearly similar example with a specific variation. The first compares final value with greatest increase, the second works with a scale of 5 units, and the third writes a full answer in context.
A lesson should also make time for the child who has gone quiet. Listening to a confident learner can help, and a quiet child needs a chance to make their own choice. The tutor can collect a one-question response privately or ask all three to hold their answers until writing time is over. Look for a session where the student is able to do several minutes of Maths independently. That is where the parent can see whether explanation has become a usable method.
End with an exit question that changes the representation or language enough to test understanding. After the line graph activity, the tutor could provide a table of four consecutive counts and ask when the increase was greatest. A student who can find the correct pair in both formats is showing transfer. A student who still points to the highest number has given useful information. On the next visit, review the distinction with a simpler example before adding other demands.
Parents comparing tuition can ask what evidence they will receive from a session. A usable note might say, “Read a bar graph with 5-unit intervals accurately. On the independent line graph, chose the highest point when asked for the largest increase. At home, try two change comparisons.” This is more actionable than a broad comment that graphs need more work. The tutor can give the student the same message in language they can use while revising.
Contents · Previous section · Next section
Decide what help fits your family
Some students need a short reset after moving into secondary school. They can complete most of their Maths exercises and need help with a recurring step, such as deciding which total belongs in the denominator. A few focused practice attempts at home may resolve it. Use the school’s notes or a worked example, try one question together, and give them a different question to try the next day. If the child can explain the choice alone in a fresh question, keep practising through regular schoolwork.
When the same confusion turns up in several tasks, take a closer look at the underlying skill. A child who misreads a bar graph and also puts numbers in the wrong place on a number line may need help recognising equal intervals. Share both examples with the school teacher or tutor. Several errors across different topics can point to one manageable piece of learning. If you bring only the latest wrong answer, the adult may see an instance without seeing the pattern.
Group tuition may suit a child who can work for a few minutes alone, compare ways of solving a problem and benefit from regular feedback. Ask for the actual class size and how the tutor handles a difference in topic coverage between students from different schools. If your child needs extra time to speak, ask what independent writing or private check is available. A workable group fit depends on how the tutor uses the time and how much attention each child receives.
For an Ang Mo Kio family, check whether the proposed lesson time fits the school day, CCA schedule and journey from the place your child will actually leave from. A trial trip during the relevant part of the day gives you a useful estimate. Decide together when your child will eat, travel and finish the rest of their homework. Use the eduKate Singapore enquiry page to confirm a suitable class and where it meets. A regular slot is easier to sustain when the family’s timetable leaves enough space afterwards for brief corrections and sleep.
If your main concern is a school assessment next week, ask the school which chapter, materials and time instructions apply. A focused review of existing mistakes may give the student more usable practice than trying every chapter in the book. If your main concern is a longer-term pattern, ask for one or two observable goals for the next month. A goal could be “independently identify and label the correct whole on three unfamiliar percentage or pie chart questions.” That goal helps teacher, parent and learner see the same progress.
Contents · Previous section · Next section
A four-week plan with room for school priorities
In the first week, select a small set of questions your child has already attempted. Ask them to read one table and one graph aloud, point to the requested values and show how they knew which intervals to count. Write down the first point of confusion. Keep a corrected example that includes labels and units. At the end of the week, repeat the skill on a different display with small numbers and the same kind of reasoning.
In the second week, practise drawing from a table. Use a graph with four categories, choose the scale, label the axes and plot the values. Set the work aside and ask your child to read the values back the next day. An independent reading problem after drawing tests whether the representation is complete. If drawing took a long time because labelling and spacing were difficult, start the next graph by preparing the axes before entering any data.
In the third week, choose one comparison that needs a calculation. Use a line graph to compare changes or a pie chart to relate a sector to the whole. Ask the child to write a numerical step and a sentence with context. A useful home review might last ten minutes. Let the student spend most of that time finding their way through the question. Correct one element clearly and keep enough practice for them to try the same element on their own.
In the fourth week, mix the representations. Give the student a short practice set with one straightforward reading task, one comparison and one prompt to choose a graph. Review accuracy alongside the independence of the attempt. If they answer correctly without speaking prompts, they are ready for slightly more complex data. If they get a correct answer only when reminded to check the scale, repeat a similar question several days later and see whether that habit has started to stick.
Adapt this sequence to the school’s actual work. If the class is studying mensuration, keep graph practice short and reserve most of the study time for current concepts. The point of a schedule is to keep a useful skill within reach. Families can begin a new four-week cycle with a different focus, such as rounding, signed numbers or reading algebraic expressions. The same method applies. Start with an independent attempt, make a precise correction and test it in a fresh question.
Contents · Previous section · Next section
Give these practice questions a first attempt
Activity sign-ups and the correct whole
A practice table records 9 sign-ups for drawing, 15 for games, 6 for reading and 10 for making a model. Each student signed up for one activity. How many students signed up altogether? What percentage chose games? What angle would games occupy on a pie chart? Which two activities together account for exactly half of the sign-ups?
First add the four counts. There were 9 + 15 + 6 + 10 = 40 sign-ups. Games account for 15/40 = 37.5%, so the angle is 15/40 × 360° = 135°. To find half of the 40 sign-ups we need two categories with a sum of 20. Check each pair. Drawing and games make 24, drawing and reading make 15, drawing and models make 19, games and reading make 21, games and models make 25, and reading and models make 16. There is no pair that sums to 20. The table makes it possible to check the implied assumption in the question.
Find the change and name the interval
A student recorded 30 minutes of reading on Monday, 38 minutes on Tuesday, 34 minutes on Wednesday and 45 minutes on Thursday. Plot the values and identify the interval with the greatest increase. By how much did Thursday’s reading time exceed the time on Monday? What can be said about the minutes on a day that was not recorded?
Put the days in order and label the vertical axis “Minutes read that day.” Monday to Tuesday rises by 8 minutes. Tuesday to Wednesday falls by 4 minutes. Wednesday to Thursday rises by 11 minutes, which is the greatest increase. Thursday exceeds Monday by 45 − 30 = 15 minutes. For an unrecorded day the exact time is unknown. Notice that these figures are separate daily totals. Thursday’s 45 minutes all belong to Thursday. With a cumulative graph showing total time through Thursday, we would need to calculate Thursday’s contribution by subtracting the cumulative total through Wednesday.
Recover the values from a symbol key
In an imagined stall practice chart, a whole picture represents 12 bags. Table A has two whole pictures and one half, Table B has one whole picture and one half, and Table C has three whole pictures. How many bags do the three tables have altogether? If 18 bags are taken away from Table C, how many pictures should be shown for Table C after the change?
Half a picture is 6 bags. Table A has 12 + 12 + 6 = 30 bags, Table B has 12 + 6 = 18, and Table C has 3 × 12 = 36. The total is 30 + 18 + 36 = 84 bags. Taking 18 from Table C leaves 18 bags. The revised display should show one whole picture and one half. Ask the child to predict whether the number of pictures should get bigger or smaller before calculating. That simple estimate catches an addition in place of a subtraction.
Compare across two different totals
At a practice weekend activity, 30 children were present on Saturday and 40 on Sunday. The art station was chosen by 12 children on Saturday and 14 on Sunday. On which day did more children choose it? On which day did a greater share of children choose it? If each day had its own pie chart, which day would have the larger art sector?
Sunday had the higher count, with 14 rather than 12. Saturday’s fraction is 12/30 = 40% and Sunday’s is 14/40 = 35%, so Saturday had the greater share. On a pie chart for each day, Saturday’s sector would have the larger angle, 144° compared with 126°. Write “higher count” and “higher share” on different lines. This makes it easier to see which question each calculation answers.
Contents · Previous section · Next section
Keep Secondary 1 assessment and the SEC in view
A Secondary 1 teacher can tell the family which parts of the current school syllabus are being covered, the dates and format of school assessments, and what work to bring for a meeting. Students who know these details can prioritise more easily. If the school expects clear labels, appropriate units or comparison statements, treat those as features of the answer from the start. A strong revision session rehearses the process used in class as well as reviewing arithmetic.
The Singapore-Cambridge Secondary Education Certificate begins in 2027. SEAB’s 2027 G1 syllabuses for school candidates list G1 Mathematics as K110 for that examination year. A student entering Secondary 1 in 2027 will generally sit national examinations in a later year. Check the school’s guidance on their eventual examination year and use the syllabus published for that year when planning formal exam preparation. The 2027 G1 Mathematics examination syllabus places Statistics and Probability in Paper 2, alongside Number and Algebra. In a longer applied question, a learner could need to select figures from a table, calculate a comparison and explain it using the labels and units from the question. Practise these as three visible steps using data the school has already taught. A short written explanation can show why both selected figures belong in the calculation.
Under Full Subject-Based Banding, Posting Groups are used for secondary school admission and are related to students’ initial subject levels. G1 refers to the level at which a specific subject is taken. School guidance on subject levels and readiness matters if your child receives an offer to study Mathematics at a different level or if teachers raise the possibility during secondary school. Ask which content the student would need to handle, what evidence the school considers and how the overall timetable would fit. Students can make thoughtful decisions about workload and learning with the school’s observations in hand.
If you bring a marked exercise to a discussion, help your child select a page they understand better now and a page that still feels difficult. The first gives the teacher evidence that the student can make a correction. The second gives everyone something specific to inspect together. You can then agree on one short next step such as relabelling axes, writing the denominator or quoting the values that support a comparison. The usefulness of additional lessons can be judged by what the student can do with that step in the next new question.