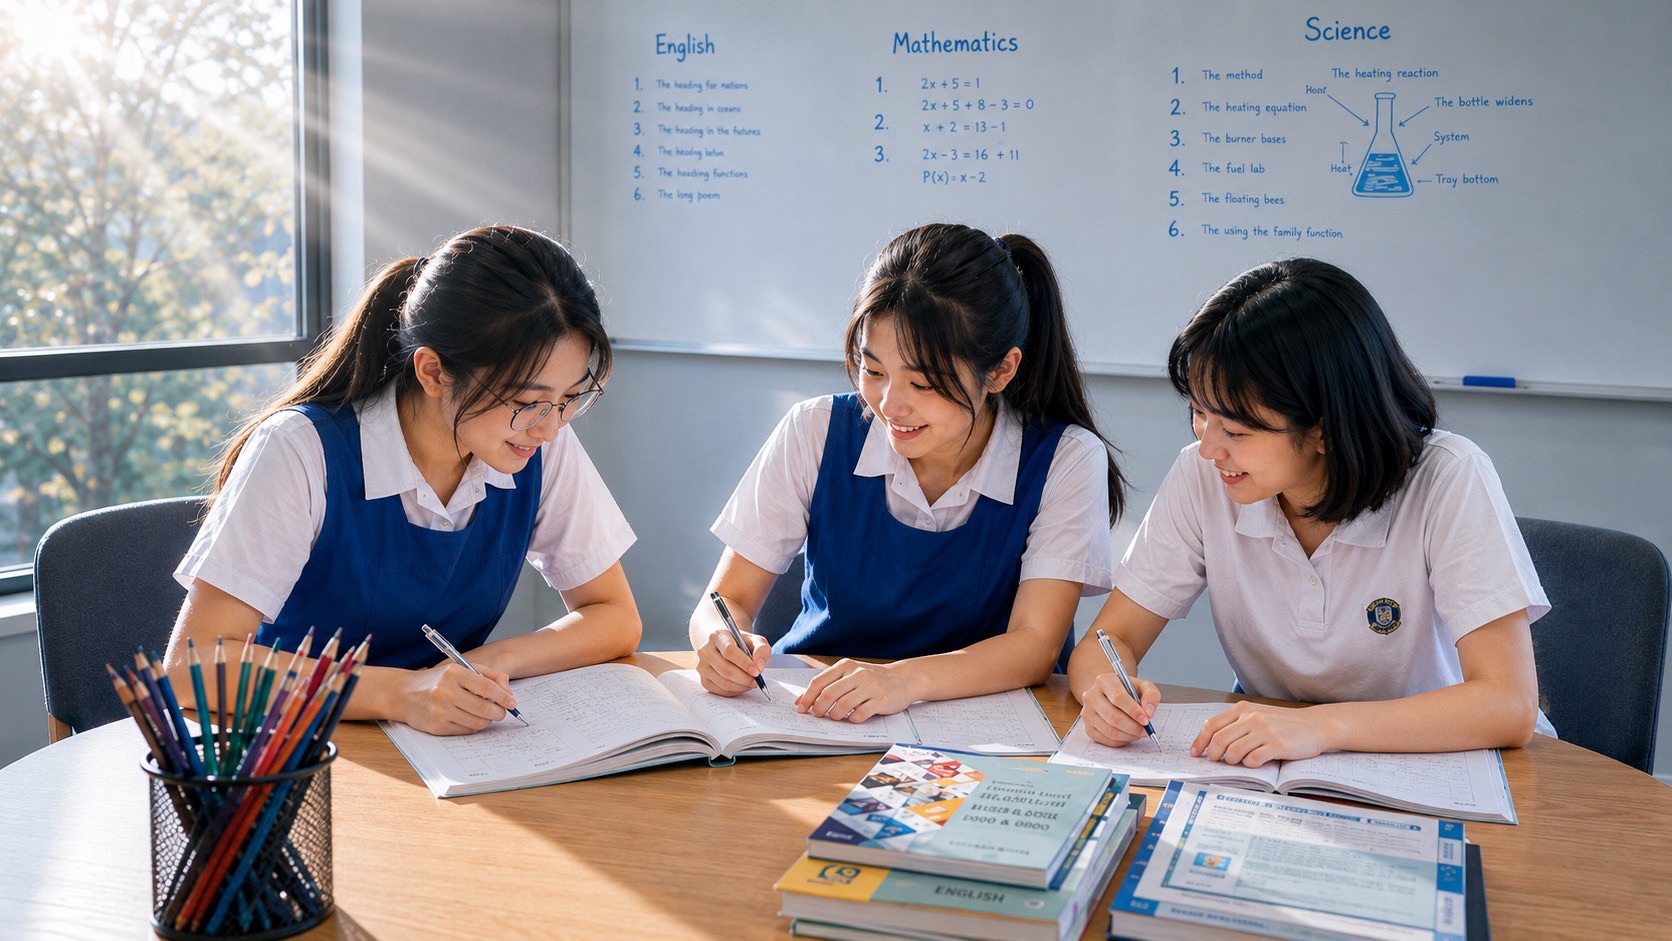
Secondary 2 Science data and experimental skills small groups tuition in Bukit Timah should help a student turn observations into a clear, supported answer. The useful work includes identifying variables, planning a fair comparison, reading measurements, interpreting tables and graphs, and explaining a result with the correct scientific idea. In a three-student tutorial, every learner should have time to attempt, explain and correct their own reasoning.
Start with the student’s current G1, G2 or G3 Science programme, recent school questions and the teacher’s feedback. Secondary 2 assessments follow the school curriculum; they are not a separate national SEAB Secondary 2 examination. This guide provides original teaching examples and a practical way to judge whether extra support is needed, what a tutor should teach, and how to review progress before upper-secondary subject decisions.
- Level: Secondary 2 Science, matched to the student’s actual subject level and school sequence.
- Learning focus: variables, fair tests, measurement, data interpretation, scientific explanations and evaluation.
- Group model: three learners, with individual attempts and feedback for each student.
- Assessment scope: school instructions govern current tests; the SEC is the later graduating examination.
- Teaching examples: all numerical datasets below are invented for practice, not reported experimental findings.
- Parent’s first step: bring a marked question and ask which part of the reasoning needs repair.
- Progress check: the student can explain and apply the idea to a different question with less help.
- Practical arrangements: confirm current subject support, fees, location and available times directly before enrolling.
EDUKATESINGAPORE · SECONDARY 2
Find your next learning step
Start with the section closest to your child’s current question, then continue through the worked examples.
Open the complete chapter index · Parent questions and next steps
Contents
Chapters 1–5
Chapters 6–10
CHAPTER 1 OF 15 · Find the learning need
1. Understand what Secondary 2 Science is asking students to do
A Science question can test several things at once. A student may need to know a concept, recognise what an unfamiliar diagram represents, interpret a measurement and choose the right relationship before writing an answer. Knowing the chapter’s definitions is helpful, but a definition alone may not complete that chain.
The MOE G2/G3 Lower Secondary Science syllabus combines scientific ideas with the practices used to investigate and explain the world. The G1 Lower Secondary Science syllabus also includes investigation, interpretation and reasoning from evidence. These are lower-secondary programmes; parents should obtain the school’s current topic sequence rather than assume that every topic belongs to Secondary 2.
For tuition, that means asking two separate questions. What scientific content is the child currently learning? What thinking skill is stopping the child from using that content? A student who understands heating but reads the temperature scale incorrectly needs a different lesson from one who reads the scale accurately but cannot explain energy transfer.
The later SEC connection
SEAB states that the Singapore-Cambridge Secondary Education Certificate begins in 2027, with examinations at the respective subject levels. That is the graduating examination framework. A student’s own examination year depends on their cohort and progression. For current Secondary 2 work, use the school assessment notice, taught topics and teacher’s instructions.
A productive preparation strategy is therefore to strengthen the habits that remain useful later: accurate observation, sensible comparisons, clear explanations and independent checking. There is little value in rushing a child through an upper-secondary paper when the central difficulty is still reading a graph axis.
CHAPTER 2 OF 15 · Find the learning need
2. Diagnose the point where the answer breaks down
Before buying a large assessment book, take one question the student answered incorrectly and remove the time pressure. Ask the student to talk through what the question provides, what it asks and what they thought the answer meant. Let them finish before correcting. The explanation often reveals information that the final mark cannot show.
Suppose a graph shows water temperature falling over time. A student writes, “The water gets colder because the line goes down.” There may be two different issues. The student has described the trend but has not explained the science. They may also think the graph causes the cooling, instead of representing measurements of it. The tutor needs to find out which interpretation is present.
| What the student does | Possible difficulty to investigate | A useful next task |
|---|---|---|
| Quotes the wrong pair of values | Axis, column or unit reading | Read two labelled values before interpreting a pattern |
| Names a variable without saying how it is measured | Vague experimental planning | State the quantity, instrument and unit |
| Restates the result when asked to explain | Missing scientific connection | Connect the observation to one relevant concept |
| Writes “make it more accurate” for every improvement | Unclear purpose of the change | Name the specific error and how the change addresses it |
| Copies a model answer but fails a new task | Dependence on the example’s wording | Apply the same idea to a changed situation |
These are starting hypotheses, not diagnoses made from one mistake. Check another question before deciding that the student has a general weakness. A tired child may miscopy a number once; a persistent misunderstanding usually appears in more than one setting.
Keep the first objective small enough to observe. “Read and label both axes correctly in three fresh examples” is more useful than “be better at Science”. A narrow objective gives the tutor something teachable and gives the student a clear sense of progress.
CHAPTER 3 OF 15 · Find the learning need
3. Turn an everyday question into measurable variables
An investigation begins with a question precise enough to test. “Which paper towel is best?” sounds simple, but “best” could mean most absorbent, strongest when wet, least expensive or easiest to recycle. Those are different questions. The learner first needs to decide which property is being compared.
For an original planning exercise, use this question: “How does the paper towel brand affect the mass of water absorbed by a sheet of fixed area using the same soaking and draining procedure?” The independent variable is the brand. The dependent variable is the mass of water absorbed, measured in grams. Naming the dependent variable as “water” is incomplete because it does not identify what is measured.
Make the measurement rule visible
One possible classroom method is to record the dry mass and then the wet mass after a standard draining time. The difference is the mass of water retained under that procedure. For example, if a dry sheet has mass 2.4 g and the wet sheet has mass 18.7 g, the recorded water mass is 16.3 g. The subtraction matters: the wet sheet’s total mass includes the paper itself.
The student should recognise that the method defines what the result means. A longer draining time could produce a different recorded mass. A test using equal sheet areas compares products on that basis; it does not automatically answer a question about equal product cost or equal dry mass.
Ask the learner to complete three sentences: “I will change…”, “I will measure…”, and “I will keep… the same because…”. The third sentence is particularly useful. It requires an explanation of why a condition matters instead of producing a memorised list of control variables.
This is a planning example, not a prescribed school practical. Actual practical work should follow the teacher’s approved equipment, procedures and safety instructions. Tuition can use a paper scenario to develop the reasoning without pretending that it replaces supervised laboratory experience.
CHAPTER 4 OF 15 · Make the comparison fair
4. Build a fair comparison and explain why it is fair
A fair comparison makes it easier to decide whether the changed factor accounts for the observed difference. It is not enough to write “keep everything the same”. Some conditions must change because they are the focus of the investigation. Others need to be controlled because they could affect the measured outcome.
Consider an imagined test of insulation around identical containers of warm water. The question is whether a particular wrapping reduces the temperature decrease during a fixed interval. Useful controls may include the starting water temperature, water volume, container type, surrounding conditions, lid arrangement and measurement interval. If one container begins much warmer, the final temperatures alone will not give a fair comparison of the wrapping.
Choose the relevant comparison
A container without wrapping can provide a baseline for comparison. That does not mean every investigation must have an identical “control experiment” with nothing added. The suitable comparison depends on the question. Comparing three brands of insulation may require a different design from testing whether insulation changes cooling compared with no wrapping.
In a teaching dataset, suppose both containers begin at 50°C. After ten minutes, the unwrapped container is at 39°C and the wrapped container is at 44°C. Their temperature decreases are 11°C and 6°C respectively. The wrapped container shows a smaller decrease under these conditions. The result does not mean the wrapping created heat.
Now change the starting temperatures to 60°C and 45°C. Ask whether comparing only the final temperatures would still be convincing. The learner should notice the unequal starting condition before reaching for a formula. This variation checks understanding of the design rather than recall of the first answer.
A good tutor also asks what cannot be controlled perfectly. Room conditions may change, and instruments may have limited resolution. Students should learn to identify important limitations and make sensible improvements, rather than promise an impossible experiment with no uncertainty.
CHAPTER 5 OF 15 · Make the comparison fair
5. Read measurements, units and precision carefully
Measurement errors can hide inside an otherwise correct explanation. Begin with the scale. If a thermometer has five equal intervals between 20°C and 30°C, each interval represents 2°C. A point three intervals above 20°C represents 26°C. Count the spaces between marked values, rather than counting the printed numbers or assuming every short mark means one degree.
Units are part of the quantity. A mass of 25 g and a volume of 25 cm³ are not interchangeable simply because they share the same number. In a calculation, carry the units through the reasoning. This makes it easier to notice when an answer describes the wrong physical quantity.
A simple measurement calculation
For a density exercise, suppose an object has mass 54 g and volume 20 cm³. Its density is 54 ÷ 20 = 2.7 g/cm³. The answer is not 2.7 g, because density describes mass per unit volume. Ask the student to explain what the number means: the object has an average mass of 2.7 g per cubic centimetre of volume in the example.
Instrument choice also matters. A bathroom scale is unsuitable for measuring the small mass change of a classroom sample, even though both activities involve mass. The useful question is whether the instrument’s range and resolution suit the quantity being measured.
Separate repeatability from closeness to the correct value. Measurements that cluster closely together can still all be shifted by an instrument’s zero error. Repeating those measurements does not automatically remove the bias. Conversely, widely scattered readings may indicate that the procedure needs better control. Students do not need elaborate terminology to understand that consistency and correctness are different questions.
For parents, the useful check is practical: can the child explain the scale, choose the unit and identify whether the final value is sensible? Those three checks often reveal more than asking whether the calculation was done “carefully”. Follow the school’s instructions on rounding and recording measurements.
CHAPTER 6 OF 15 · Make the comparison fair
6. Read a data table before calculating an average
A table is an organised record of comparisons. Before calculating anything, identify what each row represents, what each column measures and whether the conditions are comparable. The largest number may not indicate the best result; a smaller cooling decrease, for instance, may indicate better insulation in the stated test.
The following values are invented for a classroom discussion about water retained by equal-area paper towel samples. The procedure is assumed to be the same for each trial. They are not findings about any commercial product.
| Sample | Trial 1 | Trial 2 | Trial 3 | Mean |
|---|---|---|---|---|
| A | 18 | 20 | 19 | 19 |
| B | 24 | 23 | 25 | 24 |
| C | 21 | 22 | 32 | 25 |
For Sample A, the mean is (18 + 20 + 19) ÷ 3 = 19 g. Sample B has a higher mean of 24 g. Sample C’s mean is 25 g, but its readings are much more spread out. Calling C definitely the best on the basis of the mean alone overlooks something important about the evidence.
Investigate an unusual result
The 32 g reading deserves investigation. It could reflect a recording error, a changed procedure or a real variation in the sample. Do not teach students to delete the largest value automatically. They should check the record, repeat the trial where appropriate and explain any justified decision about including or excluding a result.
A careful conclusion might be: “Sample C has the highest recorded mean, but its inconsistent results mean that further trials and a procedure check are needed before making a confident comparison.” This answer uses both the average and the spread without claiming more than the small dataset supports.
The table also cannot establish which product is cheapest or most environmentally suitable. Those questions require other information. Learning to name the limits of a dataset is part of learning to use it responsibly.
A graph can reveal a pattern that is difficult to see in a list of measurements. The choice of representation should follow the data. Separate categories, such as towel brands, usually suit a bar chart. Measurements across a continuous quantity, such as temperature at successive times, may suit a line graph or plotted relationship, following the task instructions.
For an original cooling example, use times of 0, 2, 4, 6 and 8 minutes, with temperatures of 60, 53, 48, 44 and 41°C. Assume that the surroundings remain at 25°C throughout. Put time on the horizontal axis and temperature on the vertical axis. Label both axes with their quantities and units. Choose a scale that is consistent and makes the readings usable.
Describe how the change develops
The temperature decreases throughout the recorded period. The decreases across successive two-minute intervals are 7, 5, 4 and 3°C. Therefore, the temperature is falling more slowly as the experiment proceeds. “The graph slopes down” gives less information than describing the measured quantity and the changing pattern.
Do not confuse a temperature with a change in temperature. At four minutes the temperature is 48°C. Between two and four minutes, the decrease is 5°C. If a question asks for the decrease over that interval, reporting 48°C answers a different question.
A value read between measured times is an estimate. If asked for the temperature at three minutes, the student should use the graph as directed and acknowledge the limited precision of the reading. A prediction beyond eight minutes is less secure because it extends past the supplied observations. The graph does not justify predicting that the temperature will fall forever at a constant rate.
In tuition, a productive variation is to redraw the same data using different scales. Ask whether the physical cooling has changed. It has not; only the visual steepness may look different. This helps a student learn to read values and units instead of trusting the appearance of a line.
CHAPTER 8 OF 15 · Explain the evidence
8. Distinguish a description from an explanation
A description says what the evidence shows. An explanation connects that observation to a scientific idea. Both matter, and the wording of the task determines what is required. A long response that never makes the connection can be weaker than a short, precise explanation.
Return to the cooling example. “The water temperature falls from 60°C to 41°C over eight minutes” is a description supported by the data. “Thermal energy transfers from the warmer water to the cooler surroundings” provides the relevant scientific relationship, assuming the surroundings are cooler as stated in the problem.
Build the answer in a complete chain
A useful practice scaffold is: identify the outcome, cite the relevant evidence, and connect it to the concept. This is a teaching aid rather than a universal official marking formula. Some questions need only a value; others need a comparison or a longer explanation. The answer should fit the question.
For example: “The wrapping reduced the temperature decrease during the test. Both samples began at 50°C, but the wrapped sample fell by 6°C while the unwrapped sample fell by 11°C. The wrapping reduced the rate of thermal energy transfer to the cooler surroundings under these conditions.” Each sentence performs a different job.
Compare that with “The wrapped cup is hotter because insulation is good.” The weaker answer uses a broad label without describing the measured change or the mechanism. Correction should identify the missing connection, not simply replace the entire paragraph with a model answer.
Ask the student to explain the idea orally before writing it again. If the oral explanation is accurate but the written one is incomplete, focus on expression. If both are uncertain, return to the concept. Adding more sentence starters will not solve a missing scientific understanding.
Finally, remove the scaffold gradually. The aim is for the student to recognise what the task requires and build a relevant explanation independently, rather than insert the same three sentences into every answer.
CHAPTER 9 OF 15 · Explain the evidence
9. Match the strength of a conclusion to the evidence
Science questions often reward restraint. A result can support a limited conclusion without proving an unlimited claim. If one class tests a few towel samples, it can discuss those samples under that procedure. It cannot establish that a particular material is always superior in every situation.
Use precise qualifiers. “In the trials shown”, “over the measured interval” and “for samples of equal area” tell the reader what the claim covers. These phrases should carry meaning; they should not become decoration added to every sentence.
Association does not settle the cause
Imagine a fictional survey finding that students who report more outdoor time also report more water consumption. The two variables are associated in that dataset. The survey alone does not show that outdoor time caused every change in drinking. Weather, activity level, reporting accuracy and other conditions may matter.
The task is different from a controlled comparison in which a chosen factor is deliberately changed while relevant conditions are kept consistent. Students should learn to recognise whether the information came from an observation, survey, model or experiment before deciding what it can establish.
When asked for an improvement, connect the proposal to a specific limitation. “Use more samples from each brand to examine variation between sheets” is more informative than “repeat to make the answer correct”. Repetition can reveal variation; it does not guarantee that the design measures the intended property.
A limitation is not a reason to discard all evidence. It tells us how cautiously to use the evidence and what further information would help. This is a valuable habit for everyday claims as well as schoolwork: identify what was measured, consider how it was measured, and separate the observation from the larger story attached to it.
CHAPTER 10 OF 15 · Practise the reasoning
10. Try a complete original investigation question
This paper exercise is designed to reveal reasoning. It is not an official examination question, and it is not an instruction to carry out an unsupervised practical. A teacher investigates the effect of ramp height on the distance a toy car travels after leaving the ramp. The same car, ramp and floor surface are used. The car is released from rest without a push from a marked point on the ramp each time; only the height of that point is changed by adjusting the ramp angle.
| Ramp height / cm | Distance trial 1 / cm | Distance trial 2 / cm | Distance trial 3 / cm |
|---|---|---|---|
| 5 | 42 | 44 | 43 |
| 10 | 76 | 78 | 77 |
| 15 | 109 | 111 | 110 |
- Identify the independent and dependent variables.
- Explain why the car should be released without a push.
- Calculate the mean distance for each height.
- Describe the relationship supported by the results.
- Explain why the results do not establish that doubling ramp height always doubles distance.
- Suggest one useful improvement or further check, explaining its purpose.
Work through the answers
Variables: ramp height is changed; the distance travelled on the floor after leaving the ramp is measured. The starting and finishing reference points for that distance should be defined consistently. Writing only “distance” leaves the measurement less clear than it needs to be.
Release: a push would add a varying influence on the car’s motion. Releasing from rest using a consistent method helps isolate the effect of changing the ramp height. “For fairness” is a useful beginning, but explaining the influence makes the answer stronger.
Means: the values are 43 cm, 77 cm and 110 cm. Show the addition and division for at least one row when learning the method. The results indicate a greater travel distance at the greater tested heights.
Proportionality: doubling height from 5 cm to 10 cm changes the mean distance from 43 cm to 77 cm, which is not double. Three height settings also do not establish a rule for every possible height. A rising relationship is not automatically direct proportion.
Further check: use additional suitable height settings and repeat each consistently to examine the pattern more closely. Alternatively, check that the floor surface and release method remain unchanged. The proposed action should answer a real uncertainty, not simply make the report longer.
For students whose current topic includes the relevant energy ideas, the tutor can extend the discussion to why a higher release position can affect the car’s motion. Keep that extension tied to what the student has learned, and distinguish the conceptual model from the actual measurements in the table.
CHAPTER 11 OF 15 · Practise the reasoning
11. Use diagrams and models without treating them as photographs
Lower-secondary Science uses representations to make invisible or complicated processes easier to discuss. Particle diagrams, light rays, circuit symbols and simplified biological drawings each highlight selected relationships. They should be read according to their purpose, rather than treated as exact pictures of every detail.
In a particle diagram, the spacing and arrangement may represent a state of matter. If a diagram shows a substance warming, ask what the model is intended to show changing. A student should not automatically conclude that each particle itself becomes a larger object simply because the material expands.
In a circuit diagram, the symbols communicate connections. The physical length of a line on the page is not necessarily the length of a connecting wire in the actual setup. A student who follows the drawn shape without tracking the connections can misunderstand which components form a complete path.
Ask three questions about every model
What does each symbol or feature represent? Which relationship is the model helping us explain? What relevant detail does it leave out? These questions can be used with the student’s own school diagram, so the practice stays aligned with the current topic.
A tutor can then ask the learner to create a second representation. Turn a short explanation into an annotated diagram, or turn a graph into two sentences describing the quantities. If the student can move between representations while preserving the meaning, there is stronger evidence of understanding than from copying a labelled picture.
Keep diagrams economical. An accurate arrow, a clear label and a sentence explaining the direction may be more useful than a heavily decorated drawing. The purpose is to make the scientific relationship visible. A parent reviewing work can ask, “What does this arrow mean?” without needing to teach the entire topic.
CHAPTER 12 OF 15 · Practise the reasoning
12. What a three-student Science tutorial should make possible
A three-student group is useful when it creates space for thinking that the tutor can actually observe. It should not become one confident learner answering every question while two others copy. Each student needs an independent attempt before the group discussion reveals the solution.
For a data lesson, the tutor might begin by giving all three learners the same small table. One must identify the variables, one must challenge a proposed conclusion, and one must check the measurement method. These discussion roles can rotate, but every learner should still complete all three kinds of thinking in their own written work.
Teach together, check individually
After a shared explanation, use related questions with different numbers or conditions. One learner may need a table with labelled columns; another may work from a short experimental account; a third may evaluate a deliberately flawed design. The learning target can remain shared while the level of support changes.
Good feedback names the decision that needs to change. “You compared final temperatures even though the starting temperatures differed” is actionable. “Read more carefully” does not tell the student which feature to notice next time. Ask the learner to correct the answer and explain the reason for the correction.
At the end, use a fresh question without the earlier prompts. This is the point at which the tutor checks whether the child can use the idea independently. If the student still needs every step supplied, the next lesson should address that dependence rather than simply advance to a new chapter.
The three-pax format describes a teaching arrangement, not a guaranteed outcome. Before enrolling, ask whether a suitable Science group is currently available for the child’s level and school needs. The right group should permit both meaningful interaction and enough individual checking to make misunderstandings visible.
CHAPTER 13 OF 15 · Choose the next step
13. Match support to the learner and review progress
Subject level matters, but it is not a complete description of a child. Under Full Subject-Based Banding, students can offer different subjects at different levels. MOE school guidance explains that subject-level decisions consider strengths, interests and learning needs. The school should advise on the child’s actual choices and eligibility; a tuition result does not approve a change of level.
For a learner rebuilding foundations, begin with an accessible context and one clear comparison. Reduce reading load if it prevents the child from showing the scientific idea, then restore the necessary language gradually. A small table with two conditions can teach more than a crowded worksheet the child cannot interpret.
For a learner keeping pace but losing marks, inspect where reliability breaks down. Perhaps the concept is secure, but the student omits units, selects irrelevant evidence or gives a description when an explanation is required. Practice should target the recurring decision rather than repeat an entire chapter indiscriminately.
For a learner ready for extension, ask for alternative explanations, a better experimental design or an evaluation of what further evidence would discriminate between two possibilities. Deeper reasoning can provide challenge without automatically importing an upper-secondary syllabus.
A manageable four-week review
In week one, retain one independent baseline answer and identify the main gap. In week two, teach the missing connection and practise it with changed examples. In week three, mix that skill with a familiar topic and reduce prompts. In week four, compare a fresh response with the baseline and decide what still needs work. This is a suggested review structure, not a promised improvement deadline.
Look for specific changes: more accurate units, better evidence selection, a clearer causal explanation, or fewer prompts needed to start. A test score can contribute to the review, but it should be interpreted alongside the difficulty and scope of the assessment. Progress is easier to discuss when the student’s actual work is available.
Extra tuition is one possible response to a learning gap. Start by checking whether teacher clarification, school support or a more focused independent practice routine can resolve the problem. If a student already understands the work and can apply it independently, adding a lesson may not be the most useful next step.
If you are considering a Bukit Timah Science tutor, bring a marked test, a recent assignment and the school’s current topic list. Ask the tutor to show how they would teach one of the child’s actual mistakes. This makes the discussion concrete and helps distinguish a suitable teaching approach from a general claim about results.
- Which scientific idea or reasoning step needs attention first?
- How will the work match the current G1, G2 or G3 programme?
- What will each learner do independently in a three-student class?
- How will corrections be revisited in a different context?
- Which resources or practical facilities are actually available?
- What evidence will be reviewed with the parent and student?
- How much practice is expected between lessons, and can the child manage it?
Consider the whole week. Travel, meals, CCA commitments, school assignments and time to rest affect whether a lesson is sustainable. Assess the journey from the child’s actual starting point rather than relying on a general neighbourhood label. Confirm the teaching location and current arrangements directly.
Prepare for Secondary 3 decisions with evidence
Ask the school about available Science subjects, the requirements for the child’s cohort and the workload of possible combinations. Discuss interest as well as results: does the student enjoy explaining physical systems, chemical changes or living processes? Use school work and teacher feedback to make that discussion specific. Avoid treating any one subject combination as a judgement of the child’s worth.
The next useful move may be small: repair one measurement habit, learn to compare two results properly, or practise a complete explanation without prompts. When that move is clear, parents can judge whether the support is helping the child become more capable and independent.
Does knowing the keywords guarantee a good explanation?
No. A scientific term needs to be connected correctly to the situation. A student who writes “energy” without identifying the relevant transfer or change has not necessarily explained the result. Ask the learner to show how the term links the evidence to the answer.
Should all students do the same Secondary 2 Science worksheet?
Only when the worksheet fits their actual learning needs. Subject level, taught content, reading demands and prior understanding can differ. A shared idea can be taught using different amounts of support. The school programme remains the reference for current assessment preparation.
Can tuition replace school practical lessons?
No. Discussion and paper-based investigation tasks can strengthen reasoning, but practical competence includes handling apparatus and following supervised procedures. Families should ask what the tutor actually provides and continue to follow school laboratory requirements.
Where should a parent read next?
For the broader subject context, see the Secondary 2 Science small groups tuition guide. Use the official sources below for curriculum and examination information. These explain the system; they do not certify a private tuition programme or guarantee admission to a subject combination.
- MOE G2/G3 Lower Secondary Science syllabus.
- MOE G1 Lower Secondary Science syllabus.
- SEAB information about the Secondary Education Certificate.
- Government-school explanation of Full Subject-Based Banding; check the child’s own school for individual arrangements.
- eduKate class enquiries for current subject support and consultation arrangements.
Curriculum and examination references checked on 16 November 2026. All worked datasets and practice tasks in this guide are original teaching illustrations.