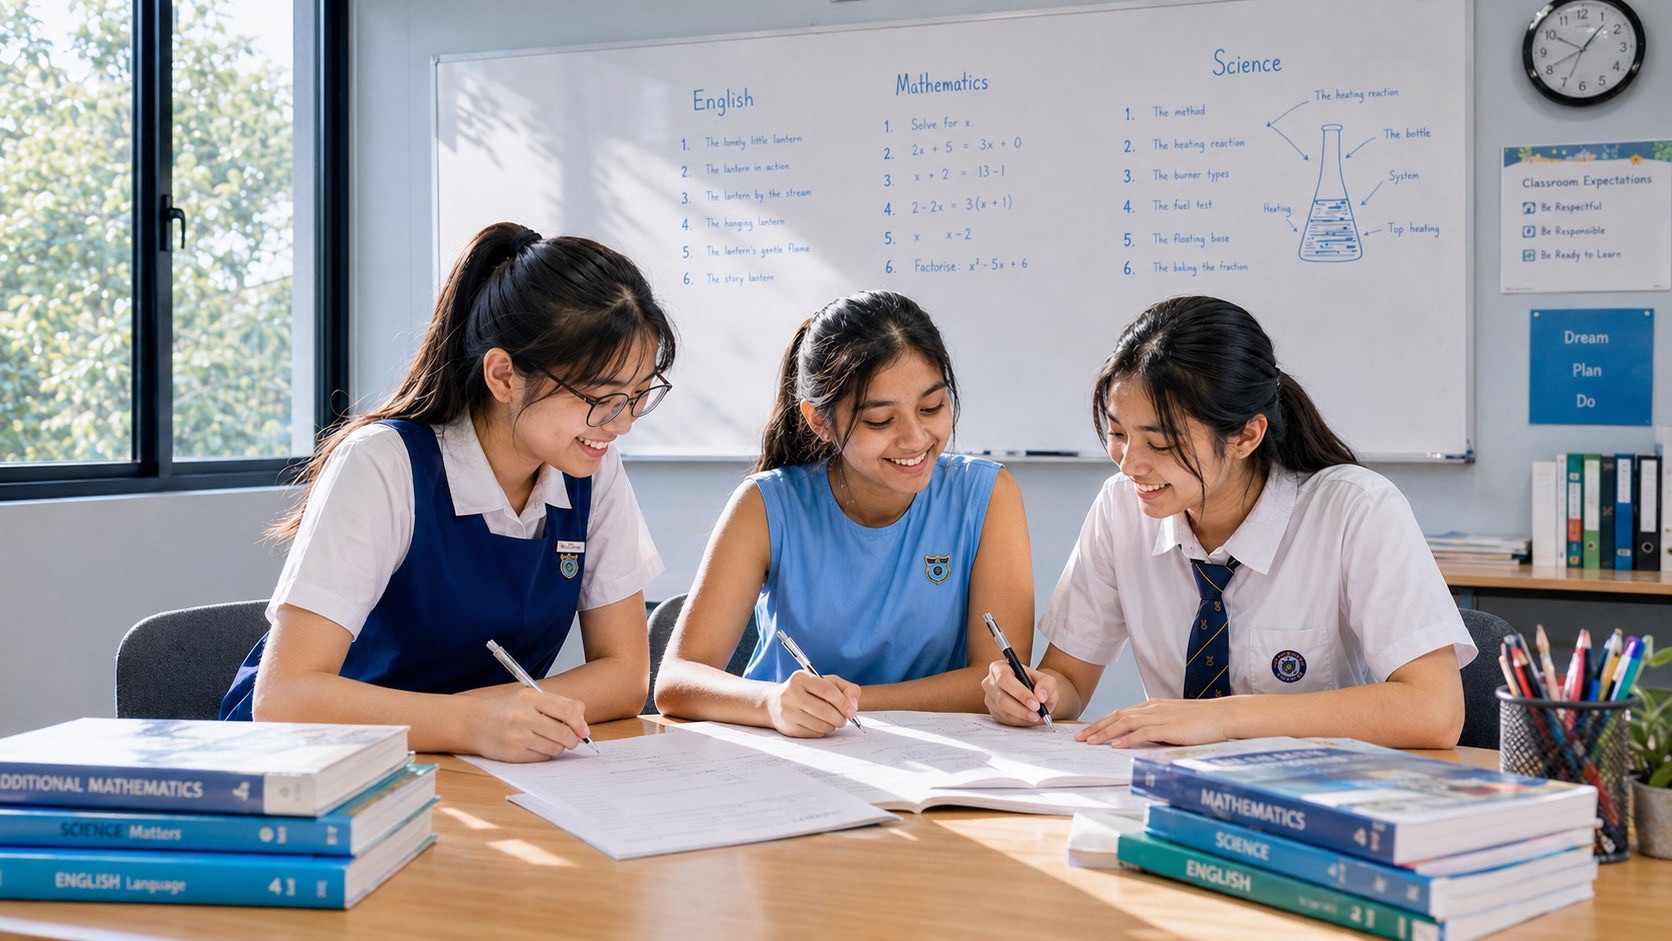
The Science subject and level a student actually takes determine how practical skills are assessed in the Singapore-Cambridge Secondary Education Certificate (SEC). Under the published 2027 syllabuses, G1 Science and the G2 two-discipline Science subjects assess experimental thinking within their listed papers. G3 two-discipline Science and the separate G3 Physics, Chemistry and Biology subjects each include a standalone practical paper. Start with the exact title and syllabus code the school confirms.
A Primary 6 family can use this distinction to ask better questions about secondary school Science. A family closer to the SEC can use it to plan the right kind of preparation. The worked examples below show how to record measurements, read results, justify a conclusion and improve a method. They use invented data for practice. Your child’s teacher is the right person to supervise laboratory procedures and explain the arrangements for the actual examination.
- Check the subject name, level, code and examination year together.
- For 2027 G1 Science K123, look for experimental and data skills in Papers 1 and 2.
- For 2027 G2 Science K223, K224 and K225, prepare to apply experimental thinking in the relevant theory papers.
- For 2027 G3 Science K326, K327 and K328, account for the combined practical in Paper 5.
- For separate 2027 G3 Physics K323, Chemistry K324 and Biology K325, account for the practical in Paper 3 for each subject entered.
- Use school laboratory time to practise handling apparatus. At home, use supplied data, diagrams and feedback to practise the thinking and recording.
Find your next subject decision
Start with the route closest to your question, or follow the chapters in order. The practical examples support a conversation with your child’s school.
1. Start
with the subject the student will actually take
Chapters 1–2
2. Work
out what observations and measurements can tell you
Chapters 3–4
3. Plot
the relationship and explain a feature of the graph
Chapters 5–6
4. Practise planning
with a supplied problem
Chapters 7–8
5. Give
feedback your child can use on a different question
Chapters 9–10
Full chapter index · PSLE Posting Groups and school-choice guide
Chapter index
Start with the subject the student will actually take · Chapters 1–2
Work out what observations and measurements can tell you · Chapters 3–4
Plot the relationship and explain a feature of the graph · Chapters 5–6
Practise planning with a supplied problem · Chapters 7–8
Give feedback your child can use on a different question · Chapters 9–10
CHAPTER 1 OF 10 · Start with the subject the student will actually take
1. Start with the subject the student will actually take
A PSLE Posting Group helps determine entry into secondary school and guides the initial subject levels. By the time a student reaches the SEC, their own subject entry is what matters for examination preparation. A student can hold a mixture of subject levels. A parent looking at a result in Mathematics or a past PSLE Posting Group therefore cannot infer which Science paper the child will sit. The PSLE Posting Groups and secondary school choice guide explains that earlier decision.
Write down four things before opening a syllabus. First, what examination year are you planning for? Second, what is the Science subject called on the school’s list? Third, what level is attached to it? Fourth, which code appears alongside the name? These checks matter because the same words can appear in two different contexts. Schoolmates may both say they take Physics and Chemistry, but one may take a single combined Science subject covering those two disciplines while the other takes two separately entered subjects. The examination papers are different.
For example, two fictional families compare notes after a talk at school. Aaron’s entry is G3 Science (Physics, Chemistry), K326. Farah has separate G3 Physics K323 and Chemistry K324 entries. Aaron plans for one Science practical paper covering the two syllabus disciplines. Farah checks the Physics practical and the Chemistry practical separately. A shared tuition folder simply marked “G3 Science” would do neither family the job of matching practice to their papers.
Families making Secondary 1 choices can ask how practical work is taught and how the school supports confidence in the laboratory. They can also ask how and when upper secondary subject combinations are decided. The question for a student close to the SEC is more specific: “Can you help us confirm the Science entries and the paper numbers we should use for planning?” Both conversations have their place. The 2027 documents illustrate the structure for that examination year. A later cohort should obtain its own year’s syllabuses when they are available. SEAB’s SEC syllabus index for school candidates.
CHAPTER 2 OF 10 · Start with the subject the student will actually take
2. Compare the 2027 Science papers by subject and level
The table sets out the differences that change a family’s preparation plan. It refers to the published 2027 school-candidate syllabuses. It is best read alongside the individual documents, where the scheme of assessment and the descriptions of the papers appear.
| 2027 school-candidate subject | Where national assessment of practical skills sits |
|---|---|
| G1 Science, K123 | No separate practical paper. Paper 1 is computer based and can use interactive or audiovisual stimuli. Paper 2 has structured and short-answer questions, including a data-response question. |
| G2 Science, K223 (Physics, Chemistry), K224 (Physics, Biology) or K225 (Chemistry, Biology) | No separate practical paper. The relevant theory papers assess experimental skills and investigations alongside other objectives. Paper numbers depend on the two disciplines the student takes. |
| G3 Science, K326 (Physics, Chemistry), K327 (Physics, Biology) or K328 (Chemistry, Biology) | Paper 5 is the practical for the two disciplines in the named combination. The syllabus lists 1 hour 30 minutes, 30 marks and 15% of the qualification. |
| Separate G3 Physics K323, Chemistry K324 and Biology K325 | Each subject has its own Paper 3 practical. Each of these syllabuses lists 1 hour 50 minutes, 40 marks and 20% for that subject’s practical paper. |
Check the documents through SEAB’s G1 school-candidate list, G2 school-candidate list or G3 school-candidate list.
The paper number can be especially misleading when families use shared materials. In the 2027 G3 combined syllabus, Paper 5 is practical. In the 2027 G2 combined syllabus, Paper 5 is the Biology multiple-choice paper for combinations that include Biology. A file labelled “Paper 5 practice” is only informative when you know which syllabus it belongs to. Add all four identifiers to the front of a revision file so your child can check them independently.
At G1 and G2, a student may still make observations and use equipment in school. They can then draw on those experiences when an examination question asks them to interpret data or discuss how a measurement was obtained. The absence of a separate practical sitting changes what goes on the examination calendar. It leaves the underlying Science skills worth learning.
CHAPTER 3 OF 10 · Work out what observations and measurements can tell you
3. Work out what observations and measurements can tell you
An observation reports what the student saw, heard or measured in the context given. An inference explains what the observation could mean. Children often jump between these jobs without noticing. Take a fictional worksheet where different coloured dots are depicted on two paper strips. A student can observe that four dots are visible on strip A and two on strip B. They might infer that strip A contains more distinguishable components under the stated conditions. The second statement goes further, so it must be checked against the question and any limitations of the method.
A measurement connects a number to a quantity and a unit. “The distance was 18.4 cm” tells the reader what 18.4 represents. “The reading is 18.4” can become ambiguous as soon as the answer is copied from the notebook into a calculation. To practise, have the child read a printed scale illustration or retrieve a scale-reading question their teacher has already marked. Ask them to explain both where the number came from and where the unit belongs.
Suppose the illustrated scale has numbered marks at 18 cm and 19 cm and ten equal intervals between them. A line lies four intervals past 18 cm, so it indicates 18.4 cm. Some students count the marks rather than the spaces and treat the scale as having eleven intervals. Cover the position of the line for a moment and ask them to prove the value of one interval using the endpoints. This habit works on an unfamiliar scale because it follows the structure of the instrument rather than a remembered picture.
School staff can show students how to view an instrument appropriately and read the graduation or display. A student who records an apparatus reading should use the precision supported by that equipment and any instruction in the paper. Seeing a calculator display several decimal places does not make the original measurement more precise. If a question specifies a precision for a calculated answer, train your child to notice that instruction before copying the number into the final box.
At home you can ask three short questions about a page of schoolwork. Which part is something you directly observed? Which number came from a scale or display? Which sentence is an interpretation? When the student can point to the three kinds of evidence, they have a way to locate mistakes in their own work.
CHAPTER 4 OF 10 · Work out what observations and measurements can tell you
4. Record results so someone else can follow the reasoning
A useful results table lets someone reconstruct what was compared, which readings belong together and how a summary value was obtained. A table heading such as “Distance / cm” carries the unit for each entry in that column. A heading saying “Length” may be too vague if a different length also appears in the task. Naming the quantity precisely helps the reader understand the investigation at a glance.
Here is a fictional record of a cart used in a school demonstration. The first column refers to the starting position measured up a sloping guide, and the travel distance is measured from where the cart leaves the guide. The purpose is to practise tracing the readings on paper. It is not a lab task to set up at home.
| Starting position along guide / cm | Travel distance, trial 1 / cm | Travel distance, trial 2 / cm | Travel distance, trial 3 / cm | Mean travel distance / cm |
|---|---|---|---|---|
| 10 | 26 | 28 | 27 | 27 |
| 20 | 39 | 40 | 41 | 40 |
| 30 | 51 | 54 | 54 | 53 |
| 40 | 63 | 65 | 67 | 65 |
For the third row the mean is (51 + 54 + 54) ÷ 3 = 53 cm. The number 53 has a clear meaning because the student can go back to the three readings and the condition under which those readings were made. If another student copied a value of 54 into the mean column, comparing the mean with the raw measurements would help them find which step to check.
Some questions provide a table for the student. Others allow the student to choose the arrangement. Either way, preserve the original measurements when the task asks for them. An unexpected value should remain visible unless the question gives an instruction about excluding it. In a normal school investigation, if a repeat is possible and appropriate, the student can explain why they made it and keep the original reading as part of the record. Simply deleting a value can leave the next reader unable to tell what happened.
Make one comparison with numbers from the table. “The cart travelled further when it started at a higher position” describes a pattern. “Between starting positions of 10 cm and 40 cm, the mean distance increased from 27 cm to 65 cm” shows where the pattern comes from. When the question asks a student to support a conclusion with evidence, a carefully chosen pair of numbers can demonstrate that they have used the results rather than guessed the trend.
CHAPTER 5 OF 10 · Plot the relationship and explain a feature of the graph
5. Plot the relationship and explain a feature of the graph
Continue with the fictional cart results. Put starting position on the horizontal axis and mean travel distance on the vertical axis if your task asks you to compare how one changes with the other. Name both quantities and their units. Look at all the values before choosing a scale. Here the position runs from 10 cm to 40 cm and the means from 27 cm to 65 cm. Pick regular intervals that leave enough room for the data and allow you to estimate sensibly between labelled grid lines.
The four points are (10, 27), (20, 40), (30, 53) and (40, 65). After plotting, check the direction of two points against the table. The reading at 30 cm should be higher on the page than the reading at 20 cm. If it is lower, a check of the two axes and the coordinate pairs is more useful than beginning the entire graph again. A small habit like this catches transposed coordinates under time pressure.
Read the question about how to represent the pattern. It may ask for a line of best fit, a curve, connected points or a graph in a particular form. A suitable line depends on the task and data. If the question asks for an approximate overall rate of change and permits using the two end points as a rough calculation, the change of 38 cm in mean travel distance divided by a 30 cm change in starting position gives about 1.27 cm of additional travel per centimetre along the guide. If the question asks for a gradient from a drawn best-fit line, use two well-separated points on that line as appropriate, which need not be measured points.
It is possible to interpolate roughly between 20 cm and 30 cm based on those two means. A starting position of 25 cm might give a distance around 46 to 47 cm if the pattern between those points is approximately straight. Extending the relation well beyond 40 cm makes a larger assumption. The child should distinguish what is inside the region they observed from a prediction outside it, where the setup or relationship might behave differently.
One short practice exercise is enough to make the method visible. Ask the student to plot the four points, write one sentence describing the trend and tell you which numbers support their sentence. Give feedback on one feature at a time. If they are confident about the trend but keep losing units, use a different small data table next session and check the labels again.
CHAPTER 6 OF 10 · Plot the relationship and explain a feature of the graph
6. Explain variation and give a realistic improvement
Suppose the 40 cm setting in the cart demonstration gave 63 cm, 65 cm and 67 cm. The range is 4 cm, found by subtracting 63 from 67. The mean is 65 cm. These numbers answer separate questions. The mean gives one way to summarise the three readings. The range shows how far apart the extremes are. Neither number tells you by itself whether the apparatus was correctly set up.
Compare another fictional set: 65 cm, 65 cm and 65 cm, with a tape that adds 2 cm to every reading because its starting mark is misaligned. The readings are very consistent but would all overstate the travel distance. Repeating measurements helps a student notice variation. Checking the setup, the zero position or a reference value addresses a different concern. Ask your child to explain which problem their proposed improvement is meant to address.
Now change just one row of the first table. At 30 cm, let the three readings be 51 cm, 54 cm and 70 cm. The 70 cm result is much higher than its two companions. The table shows a reason to investigate. It does not establish exactly why the reading differed. Maybe the release differed, maybe the stopping point was read incorrectly or maybe something else changed. An answer such as “I would check whether the cart was pushed rather than released, and repeat the reading under the same starting conditions if the task allows” ties the next action to an identifiable concern.
A good evaluation names a source of uncertainty or error and explains how the improvement would help. “Use better equipment” leaves most of the thinking hidden. “Fix a clear marker at the end of the guide and read from the same reference point each time” suggests what would change and why repeated distances would be more comparable. “Be more careful” is less informative than explaining how a particular inconsistency could be avoided.
Keep the scale of the conclusion proportionate. The cart data support a trend under the conditions and range shown. They do not establish how every cart behaves on every surface. A useful extension could ask whether the trend remains on a different surface, keeping the starting positions and the cart the same where appropriate. A proposed improvement, by contrast, focuses on making the existing comparison clearer. Naming which of those jobs the question asks for can prevent a student from writing an interesting answer to a different problem.
CHAPTER 7 OF 10 · Practise planning with a supplied problem
7. Practise planning with a supplied problem
A practical planning question can ask for a method a student describes on paper. The exact skills and requirements depend on the syllabus. The G3 separate Science syllabuses describe assessment areas that include planning, making observations and measurements, presenting data and analysing or evaluating results. The G3 combined Science syllabus also describes practical questions in which students suggest a modification or an extension without necessarily carrying it out. Read the relevant scheme before deciding which exercise to practise. SEAB’s 2027 G3 Science subject list.
As a safe paper exercise, give your child a photograph of two classroom illustrations showing five dark shapes against a light background. The hypothetical question is whether people count the shapes differently when the display is further away. Ask the child to name the variable to change, the thing to measure and two conditions that should stay comparable. They might change viewing distance, record the number of shapes counted and keep the illustration and lighting consistent. They could use several distances and report each count in a table.
Then ask what might spoil the comparison. If the same participant sees the same arrangement in the same order several times, memory of the earlier count could affect the answer. The student might plan to record the first view from each participant or discuss with a teacher how to handle the order of conditions fairly. The point is to hear how they reason about a particular concern. This is an illustration of experimental thinking, with no claim that the scenario matches a future examination question.
Give the child a planning response that says only “Repeat it three times and take the average.” Ask them to improve it without adding unnecessary sentences. They need to name what will be repeated, what data will be recorded, and what the resulting value will help them compare. When the student tells you all three, they have already moved from a memorised sentence to a method they can explain.
A parent can do this work with a printed diagram and pencil. A teacher can then help the child connect it to discipline-specific equipment, methods and safety rules. Where the student’s course assesses practical thinking in written or computer-based papers, the aim is still to practise using the exact information supplied. Where it has a dedicated practical paper, both written reasoning and supervised experience with equipment belong in the preparation.
CHAPTER 8 OF 10 · Practise planning with a supplied problem
8. Plan school and home practice around the real papers
Start by asking the student to identify the part that feels difficult. One child knows what to measure but gets flustered recording it before the task moves on. Another fills the table accurately yet struggles to explain whether the data support a prediction. Use the difficulty to decide what to rehearse. A second full paper will be more valuable when the student can name what to check within it.
For a G1 or G2 learner, ask the teacher to identify a question where earlier classroom practical work is tested through a diagram, set of results or written method. Have your child first underline what they are being asked to do. Then ask them to point to the evidence before writing. In a G1 session, if the classroom has demonstrated a computer-based format, the student can also explain how they located the information in the stimulus. Use the school’s familiarisation guidance to learn how the published assessment is presented.
For a G3 student with a dedicated practical paper, use supervised school laboratory practice to build confidence with apparatus and procedures. At home, choose quieter tasks: interpreting an old results table, rewriting one vague evaluation, comparing a graph with its data or planning a follow-up question. A parent does not need to recreate the laboratory to help a child organise their explanations. Bring any question about equipment, materials or technique back to the teacher.
Consider a student who has consistent graphing errors. On Monday they label axes and choose sensible scales from three sets of supplied values. Later in the week, they plot one small dataset and check two coordinates. When their teacher returns a practical worksheet, they compare that practice against the feedback and note one issue still recurring. After two or three short sessions the family can ask whether the student is recognising the error on their own. Progress is easier to judge when the task and the check are both specific.
Leave room for other SEC components. The standalone practical is one part of the relevant subject, and a child may have practicals in two or more separate Sciences. Read the candidate timetable when it is issued and check each subject entry separately. Use the time listed in the syllabus to understand the paper and the personalised timetable to confirm attendance details. SEAB’s SEC examination overview.
CHAPTER 9 OF 10 · Give feedback your child can use on a different question
9. Give feedback your child can use on a different question
Read a previously marked answer together and identify where the student’s reasoning became difficult to follow. Imagine the question asks whether two groups of readings agree closely. The child replies, “The first test was more accurate.” Ask which measurements they compared and whether a known reference value was supplied. They may have noticed that the first group varied less, which supports a comment about the spread of the readings. Establishing which one was nearer the true value would require a reliable reference or another reason to judge the measurements. Have your child revise the sentence so the claim matches the evidence.
Next, give them new numbers with the same underlying decision. A sample of three readings is 24 cm, 25 cm and 26 cm. Another sample is 22 cm, 25 cm and 28 cm. Both means are 25 cm. The first range is 2 cm and the second is 6 cm. A good answer can name the first group as more closely clustered in this sample, cite the ranges and avoid making a claim about which mean is closer to the true value. The child can then highlight the words that make the conclusion precise.
If you can still hear the student explaining the difference a few days later with unfamiliar numbers, the feedback has travelled beyond the first problem. If they revert to the old wording, take the marked answer and the second example to the next teacher conversation. Ask which term the syllabus or classroom uses and how the class distinguishes it from related terms. That follow-up gives the student something specific to listen for and practise in the next practical lesson.
CHAPTER 10 OF 10 · Give feedback your child can use on a different question
10. Questions parents and students ask
My child does experiments at school in G2. Does that prove there is a national practical sitting?
School laboratory activities teach students how evidence is obtained. For the published 2027 G2 Science combinations, the national assessment scheme lists the relevant theory papers and includes experimental skills as an assessment objective. Open the specific syllabus when you want to know the national paper list. The student’s teacher can show you how laboratory experiences connect to the questions they will answer. SEAB’s G2 school-candidate subject list.
Does G3 Science always mean two or three separate practicals?
Look at the exact entries. For one of the listed 2027 G3 combined Science subjects, the student takes the one Paper 5 for that combination. A student entered for separate standalone G3 Sciences has a Paper 3 within each of those individual subjects. Check each entry and make a list of dates when the school or examining authority issues the relevant timetable.
Is every graph meant to pass through zero?
Check what the question asks and what the evidence supports. A relationship may run through the origin if the variables and data justify it. In other circumstances, the points or instructions may describe a different relation. A line drawn through zero by habit can change the interpretation. Plot the data accurately first, read the instruction and decide whether the origin is relevant.
Should we correct a result if it looks unusual?
Record what the student measured and flag why it needs checking. If the instructions and circumstances permit, repeat or verify the reading. If the question gives a dataset, interpret it as supplied unless instructed otherwise. A student can identify a possible anomaly and explain how it affects a conclusion without silently altering the numbers.
What should my child do when they are unsure how to handle apparatus?
During school practice, pause and ask the teacher to show the approved technique. In an examination, follow the paper and the invigilator’s instructions, including the procedure for reporting a problem. A student can use the next practice session to explain what confused them before trying again. Keep home study to paper, diagrams, harmless everyday observations and the teacher’s feedback.
How early should a family organise national practical practice?
A Secondary 1 student can start now by getting comfortable with units, scales, clear tables and evidence. Closer to the SEC, confirm the actual subject entries and ask the school about its supervised practical preparation. A Primary 6 family comparing secondary schools can ask how each school introduces these skills and helps students build confidence over time. You can revisit the precise assessment format when the Science course and examination year are known.
Where should I look if a guide gives a different format?
Return to the syllabus for the student’s own level, subject code, examination year and candidate category. Check the scheme of assessment, then ask the school if the entry or format is still unclear. An older worksheet can still be useful for practising a scientific skill once the teacher has matched it to the course. Use official examination information and the school’s instructions to resolve the actual appointment, equipment and paper details. SEAB’s school-candidate syllabus index.
Contents · Previous chapter · Continue to the Posting Groups guide
Practical SEC guides for families
Read about digital papers, coursework, exam-day disruptions and private registration.